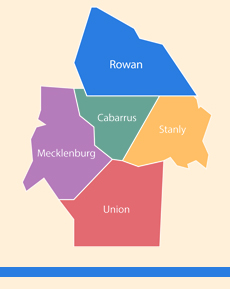
Rowan County Quality
Licensed Child Care Centers
| License Type | Number of Programs | Percent of Programs | Number of Slots | Percent of Slots |
|---|---|---|---|---|
| 1 Star | 0 | 0% | 0 | 0% |
| 2 Stars | 0 | 0% | 0 | 0% |
| 3 Stars | 2 | 4.8% | 131 | 4.3% |
| 4 Stars | 7 | 16.7% | 447 | 14.6% |
| 5 Stars | 27 | 64.3% | 2,109 | 69% |
| Sub Total | 36 | 85.7% | 2,687 | 88% |
| GS110-106 | 3 | 7.1% | 176 | 5.8% |
| Temporary | 2 | 4.8% | 108 | 3.5% |
| Provisional | 1 | 2.4% | 84 | 2.7% |
| Probationary | 0 | 0% | 0 | 0% |
| Total | 42 | 100% | 3,055 | 100% |
Source: Child Care Resources Inc.; June 30, 2016.
Licensed Family Child Care Homes
| License Type | Number of Programs | Percent of Programs | Number of Slots | Percent of Slots |
|---|---|---|---|---|
| 1 Star | 2 | 11.1% | 16 | 11.6% |
| 2 Stars | 1 | 5.6% | 8 | 5.8% |
| 3 Stars | 4 | 22.2% | 29 | 21% |
| 4 Stars | 4 | 22.2% | 32 | 23.2% |
| 5 Stars | 7 | 38.9% | 53 | 38.4% |
| Sub Total | 18 | 100% | 138 | 100% |
| GS110-106 | 0 | 0% | 0 | 0% |
| Temporary | 0 | 0% | 0 | 0% |
| Provisional | 0 | 0% | 0 | 0% |
| Probationary | 0 | 0% | 0 | 0% |
| Total | 18 | 100% | 138 | 100% |
Source: Child Care Resources Inc.; June 30, 2016.
