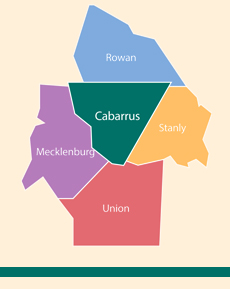
Cabarrus County Needs
Total Population
| 2018 | |
|---|---|
| Cabarrus County | 200,663 |
Source: NC Office of State Budget and Management; 2016 Population Estimates, updated 2017.
Child Population
| 2018 | |
|---|---|
| 0 - 2 years | 7,230 |
| 3 - 4 years | 4,715 |
| 5 years | 2,451 |
| 6 - 13 years | 20,520 |
| Total: | 34,916 |
Source: NC Office of State Budget and Management; 2016 Population Estimates, updated 2017.
All Women with Related Children Under 18 Years
| 2018 | |
|---|---|
| Number of women | 24,267 |
Source: U.S. Census Bureau; 2016 American Community Survey 1-Year Estimates; Table B11004.
Women Ages 20-64 in the Labor Force
| 2018 | |
|---|---|
| With own children under age 6 | 3,368 |
| With own children under age 6 and 6-18 | 2,575 |
| With own children ages 6-18 | 11,303 |
| Single living in poverty with children <5 | 895 |
Source: U.S. Census Bureau; 2016 American Community Survey 1-Year Estimates; Tables B23003 and B17010.
Households with Own Children Under Age 6
| 2018 | |
|---|---|
| Lives with two parents (both working) | 5,265 |
| Lives with father only (working) | 935 |
| Lives with mother only (working) | 2,866 |
| Lives with two parents (one working) | 4,881 |
| Not in labor force | 559 |
| Total: | 14,506 |
Source: U.S. Census Bureau; 2016 American Community Survey 1-Year Estimates; Table B23008.
Income Ranges for Households
| 2018 | |
|---|---|
| < $10,000 | 2,996 |
| $10,000 - $14,999 | 2,492 |
| $15,000 - $24,999 | 5,531 |
| $25,000 - $34,999 | 7,572 |
| $35,000 - $49,999 | 8,411 |
| $50,000 - $74,999 | 14,808 |
| $75,000+ | 28,628 |
| Total: | 70,438 |
Source: U.S. Census Bureau; 2016 American Community Survey 1-Year Estimates; Table B19001.
Pregnancies and Births - Ages 15 - 19
| 2018 | |
|---|---|
| Live Births | 115 |
| Birth Rate | 17 |
| Pregnancies | 147 |
| Pregnancy Rate | 21 |
Rates: Per 1,000
Source: NC State Center For Health Statistics; 2017.
Source: NC State Center For Health Statistics; 2017.
Pregnancies and Births - Ages 15 - 44
| 2018 | |
|---|---|
| Live Births | 2,593 |
| Birth Rate | 63 |
| Pregnancies | 2,977 |
| Pregnancy Rate | 72 |
Rates: Per 1,000
Source: NC State Center For Health Statistics; 2017.
Source: NC State Center For Health Statistics; 2017.
Families (with related children) and Poverty
| 2018 | |
|---|---|
| All families | 50,005 |
| Families living below poverty level | 4,206 |
| All families with children <5 | 8,374 |
| All with children <5 below poverty level | 1,701 |
| All with children <18 | 26,064 |
| All with children <18 below poverty level | 3,771 |
Source: U.S. Census Bureau; 2016 American Community Survey 1-Year Estimates; Table B17010.
Children and Poverty
| 2018 | |
|---|---|
| All children < 18 | 51,788 |
| All <18 below poverty level | 10,123 |
| All children < 5 | 12,292 |
| All <5 below poverty level | 2,683 |
| All children 5 to 18 | 39,496 |
| All 5 to 18 below poverty level | 7,440 |
Source: U.S. Census Bureau; 2016 American Community Survey 1-Year Estimates; Table B17001.