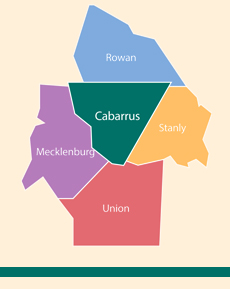
Cabarrus County Needs
Total Population
| 2017 | |
|---|---|
| Cabarrus County | 195,714 |
Source: NC Office of State Budget and Management, July 1, 2015 County Total Age Groups, updated September 2016.
Child Population
| 2017 | |
|---|---|
| 0 - 2 years | 7,054 |
| 3 - 4 years | 4,753 |
| 5 years | 2,512 |
| 6 - 13 years | 23,620 |
| Total: | 37,939 |
Source: NC Office of State Budget and Management, July 1, 2015 County Total Age Groups, updated September 2016.
All Women with Related Children Under 18 Years
| 2017 | |
|---|---|
| Number of women | 25,001 |
Source: U.S. Census Bureau; 2015 American Community Survey 1 Year Estimates; Table B11004.
Women Ages 20-64 in the Labor Force
| 2017 | |
|---|---|
| With own children under age 6 | 4,348 |
| With own children under age 6 and 6-18 | 2,812 |
| With own children ages 6-18 | 11,647 |
| Single living in poverty with children <5 | 832 |
Source: U.S. Census Bureau; 2015 American Community Survey 1-Year Estimates; Table B23003 and B17010.
Households with Own Children Under Age 6
| 2017 | |
|---|---|
| Lives with two parents (both working) | 7,758 |
| Lives with father only (working) | 684 |
| Lives with mother only (working) | 2,223 |
| Lives with two parents (one working) | 2,310 |
| Not in labor force | 965 |
| Total: | 13,940 |
Source: U.S. Census Bureau, 2015 American Community Survey 1-Year Estimates, Table B23008.
Income Ranges for Households
| 2017 | |
|---|---|
| < $10,000 | 3,749 |
| $10,000 - $14,999 | 3,175 |
| $15,000 - $24,999 | 6,723 |
| $25,000 - $34,999 | 7,665 |
| $35,000 - $49,999 | 9,106 |
| $50,000 - $74,999 | 13,035 |
| $75,000+ | 27,170 |
| Total: | 70,623 |
Source: U.S. Census Bureau; 2015 American Community Survey 1-Year Estimates; Table B19001.
Pregnancies and Births - Ages 15 - 19
| 2017 | |
|---|---|
| Live Births | 110 |
| Birth Rate | 16 |
| Pregnancies | 157 |
| Pregnancy Rate | 23 |
Rates: Per 1,000
Source: NC State Center For Health Statistics; 2016.
Source: NC State Center For Health Statistics; 2016.
Pregnancies and Births - Ages 15 - 44
| 2017 | |
|---|---|
| Live Births | 2,477 |
| Birth Rate | 61 |
| Pregnancies | 2,893 |
| Pregnancy Rate | 72 |
Rates: Per 1,000
Source: NC State Center For Health Statistics; 2016.
Source: NC State Center For Health Statistics; 2016.
Families (with related children) and Poverty
| 2017 | |
|---|---|
| All families | 53,023 |
| Families living below poverty level | 4,452 |
| All families with children <5 | 9,776 |
| All with children <5 below poverty level | 1,313 |
| All with children <18 | 27,618 |
| All with children <18 below poverty level | 3,501 |
Source: U.S. Census Bureau, 2015 American Community Survey 1-Year Estimates, Table 17010.
Children and Poverty
| 2017 | |
|---|---|
| All children < 18 | 50,875 |
| All <18 below poverty level | 7,262 |
| All children < 5 | 12,035 |
| All <5 below poverty level | 1,907 |
| All children 5 to 18 | 38,840 |
| All 5 to 18 below poverty level | 5,355 |
Source: U.S. Census Bureau; 2015 American Community Survey, Table B17001.
